Multiple Choice
Figure 8-4 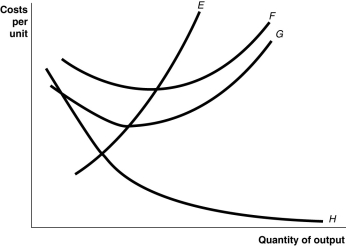
-Refer to Figure 8-4.The vertical difference between curves F and G measures
A) average fixed costs.
B) marginal costs.
C) fixed costs.
D) sunk costs.
Correct Answer:
Verified
Related Questions
Q100: Figure 8-3 Q102: Table 8-3 Q103: Table 8-3 Q107: Figure 8-4 Q162: When the average total cost is $16 Q202: Suppose the total cost of producing 40,000 Q205: Explain how the listed events (a-d)would affect Q207: As output increases, average fixed cost gets Q215: Long-run cost curves are U-shaped because Q216: Economies of scale exist as a firm Unlock this Answer For Free Now! View this answer and more for free by performing one of the following actions Scan the QR code to install the App and get 2 free unlocks Unlock quizzes for free by uploading documents![]()
![]()
![]()
![]()
A)of the

