Multiple Choice
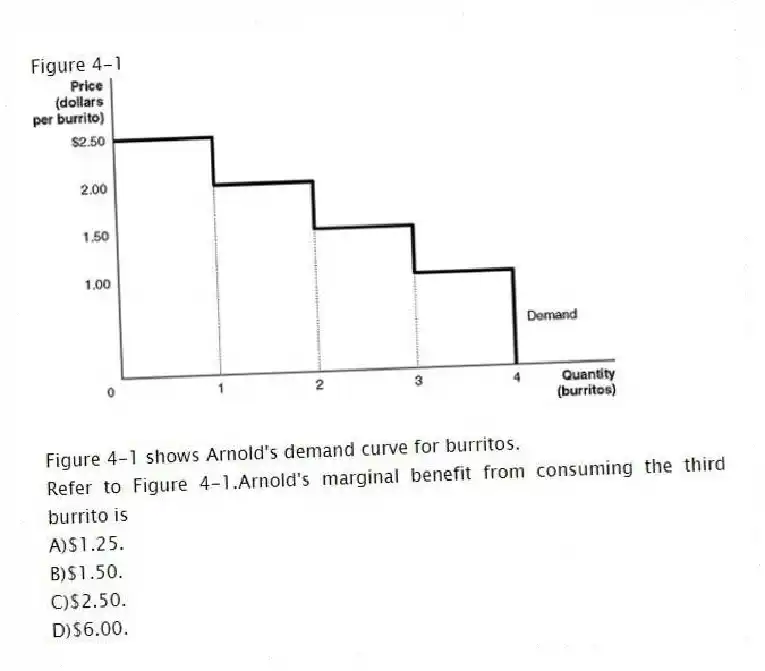
Figure 4-1

Figure 4-1 shows Arnold's demand curve for burritos.
-Refer to Figure 4-1.Arnold's marginal benefit from consuming the third burrito is
A) $1.25.
B) $1.50.
C) $2.50.
D) $6.00.
Correct Answer:
Verified
Related Questions
Q18: In a city with rent-controlled apartments, all
Q19: Each point on a _ curve shows
Q20: Table 4-2 Q21: Figure 4-1 Q22: Figure 4-1 Q24: Consumer surplus in a market for a Q25: Table 4-3 Q26: A demand curve shows Q27: Table 4-3 Q28: The total amount of producer surplus in Unlock this Answer For Free Now! View this answer and more for free by performing one of the following actions Scan the QR code to install the App and get 2 free unlocks Unlock quizzes for free by uploading documents
![]()
![]()
![]()
![]()
A)the willingness of consumers
![]()

