Table 4-3
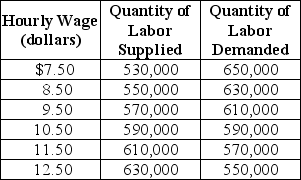
Table 4-3 shows the demand and supply schedules for labor market in the city of Pixley.
-Refer to Table 4-3.Suppose that the quantity of labor demanded decreases by 80,000 at each wage level.What are the new free market equilibrium hourly wage and the new equilibrium quantity of labor?
A) W = $8.50; Q = 550,000
B) W = $12.50; Q = 630,000
C) W = $9.50; Q = 570,000
D) W = $9.50; Q = 590,000
Correct Answer:
Verified
Q73: The graph below represents the market for
Q80: Table 4-3 Q103: When a competitive equilibrium is achieved in Q113: Figure 4-5 Q120: To affect the market outcome, a price Q123: Figure 4-5 Q128: Figure 4-5 Q129: In order to be binding, a price Q133: Figure 4-5 Q219: Table 4-7 Unlock this Answer For Free Now! View this answer and more for free by performing one of the following actions Scan the QR code to install the App and get 2 free unlocks Unlock quizzes for free by uploading documents
![]()
![]()
![]()
![]()
![]()
![]()

