Figure 18-4 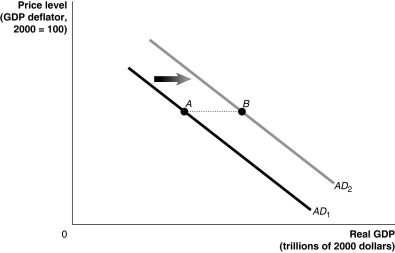
-Refer to Figure 18-4.In the graph above,the shift from AD1 to AD2 represents the total change in aggregate demand.If government purchases increased by $50 billion,then the distance from point A to point B ________ $50 billion.
A) would be equal to
B) would be greater than
C) would be less than
D) may be greater than or less than
Correct Answer:
Verified
Q70: The aggregate demand curve will shift to
Q102: What are the key differences between how
Q105: If real equilibrium GDP is above potential
Q121: If the tax multiplier is -1.5 and
Q127: The tax multiplier equals the change in
Q128: Suppose the government spending multiplier is 2.The
Q131: The government purchases multiplier equals the change
Q133: Which of the following would increase the
Q136: The aggregate demand curve will shift to
Q140: The aggregate demand curve will shift to
Unlock this Answer For Free Now!
View this answer and more for free by performing one of the following actions

Scan the QR code to install the App and get 2 free unlocks

Unlock quizzes for free by uploading documents