Figure 11-3 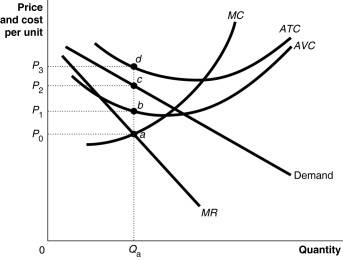 Figure 11-3 shows short-run cost and demand curves for a monopolistically competitive firm in the market for designer watches.
-Refer to Figure 11-3.What is the area that represents the total fixed cost of production?
A) 0P1aQa
B) P0adP3
C) P1bdP3
D) That information cannot be determined from the graph.
Correct Answer:
Verified
Q25: Table 11-1 Q30: Figure 11-3 Q32: Figure 11-3 Q38: Which of the following statements is true Q41: What are the most important differences between Q45: When a monopolistically competitive firm cuts its Q62: A monopolistically competitive firm maximizes profit where Unlock this Answer For Free Now! View this answer and more for free by performing one of the following actions Scan the QR code to install the App and get 2 free unlocks Unlock quizzes for free by uploading documents
![]()
![]()
A)price

