Multiple Choice
Figure 10-2 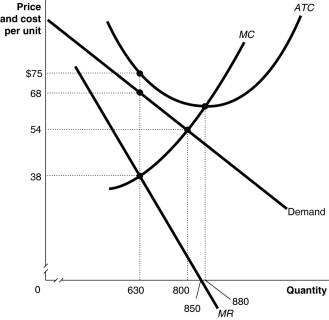 Figure 10-2 above shows the demand and cost curves facing a monopolist.
-Refer to Figure 10-2.Suppose the monopolist represented in the diagram above produces positive output.What is the profit-maximizing/loss-minimizing output level?
A) 630 units
B) 800 units
C) 850 units
D) 880 units
Correct Answer:
Verified
Related Questions
Q61: Figure 10-2 Q64: Figure 10-2 Q68: Figure 10-3 Q69: Figure 10-3 Q102: Long-run economic profits would most likely exist Unlock this Answer For Free Now! View this answer and more for free by performing one of the following actions Scan the QR code to install the App and get 2 free unlocks Unlock quizzes for free by uploading documents![]()
![]()
![]()
![]()

