Figure 10-2 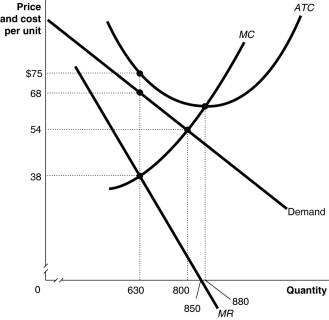 Figure 10-2 above shows the demand and cost curves facing a monopolist.
-Refer to Figure 10-2.Suppose the monopolist represented in the diagram above produces positive output.What is the price charged at the profit-maximizing/loss-minimizing output level?
A) $38
B) $54
C) $68
D) $75
Correct Answer:
Verified
Q59: Figure 10-1 Q64: Figure 10-2 Q66: Figure 10-2 Q82: Provide two examples of a government barrier Q88: If a monopolist's price is $50 per Q91: If a theatre company expects $250,000 in Q98: If a monopolist's marginal revenue is $25 Q102: Long-run economic profits would most likely exist Q123: In the short run, even if a Q129: If a monopolist's price is $50 at Unlock this Answer For Free Now! View this answer and more for free by performing one of the following actions Scan the QR code to install the App and get 2 free unlocks Unlock quizzes for free by uploading documents![]()
![]()
![]()

