Multiple Choice
Figure 10-3 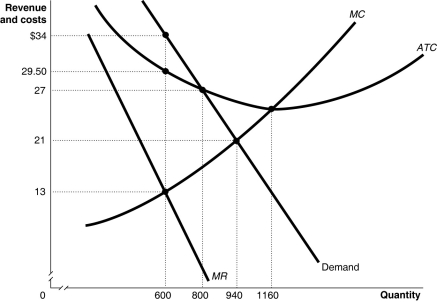 Figure 10-3 shows the demand and cost curves for a monopolist.
-Refer to Figure 10-3.What is the amount of the monopoly's profit?
A) $2,700
B) $4,200
C) $10,400
D) $12,600
Correct Answer:
Verified
Related Questions
Q75: Figure 10-3 Q76: Figure 10-3 Q81: Figure 10-5 Q82: Table 10-2 Q83: Figure 10-4 Q84: Figure 10-5 Q85: Figure 10-6 Q108: Table 10-1 Q110: Which of the following statements applies to Q120: Table 10-1 Unlock this Answer For Free Now! View this answer and more for free by performing one of the following actions Scan the QR code to install the App and get 2 free unlocks Unlock quizzes for free by uploading documents![]()
![]()
![]()
![]()
![]()
![]()
![]()

