Figure 10-8 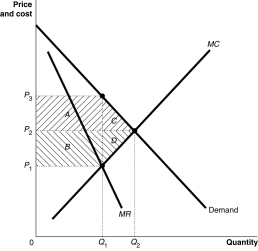
-Refer to Figure 10-8.From the monopoly graph above,identify the following:
a.The profit maximizing price
b.The profit maximizing quantity
c.The area representing deadweight loss
d.The area representing the transfer of consumer surplus to the monopoly
Correct Answer:
Verified
b.Quantity = Q1
c.D...
View Answer
Unlock this answer now
Get Access to more Verified Answers free of charge
Q145: Compared to perfect competition, the consumer surplus
Q163: The size of a deadweight loss in
Q194: Suppose a monopoly is producing its profit-maximizing
Q195: In reality, because few markets are perfectly
Q201: The Clayton Act prohibited
A)all vertical mergers.
B)all horizontal
Q203: A merger between the Ford Motor Company
Q207: The Sherman Act prohibited
A)marginal cost pricing.
B)setting price
Q209: How do the price and quantity of
Q216: A merger between U.S.Steel and General Motors
Q219: When a proposed merger between two companies
Unlock this Answer For Free Now!
View this answer and more for free by performing one of the following actions

Scan the QR code to install the App and get 2 free unlocks

Unlock quizzes for free by uploading documents