Figure 10-9 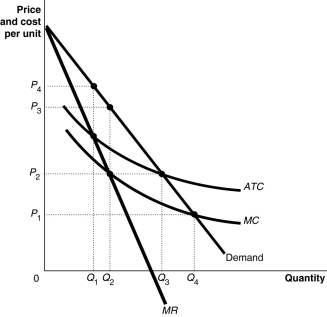 Figure 10-9 shows the cost and demand curves for the Erickson Power Company.
-Refer to Figure 10-9.The firm would maximize profit by producing
A) Q1 units.
B) Q2 units.
C) Q3 units.
D) Q4 units.
Correct Answer:
Verified
Q133: Figure 10-7 Q136: The standards used by the Department of Q140: Figure 10-9 Q209: Figure 15-14 Q210: A possible advantage of a horizontal merger Q224: Natural monopolies in the United States are Q230: In regulating a natural monopoly, the price Q240: If a natural monopoly regulatory commission sets Q262: A product's price approaches its marginal cost Q265: Holding everything else constant, government approval of Unlock this Answer For Free Now! View this answer and more for free by performing one of the following actions Scan the QR code to install the App and get 2 free unlocks Unlock quizzes for free by uploading documents![]()
![]()
![]()

