Multiple Choice
Figure 10-9 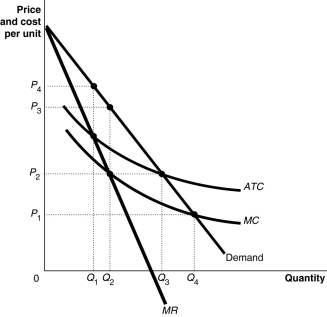 Figure 10-9 shows the cost and demand curves for the Erickson Power Company.
-Refer to Figure 10-9.The profit-maximizing price is
A) P1.
B) P2.
C) P3.
D) P4.
Correct Answer:
Verified
Related Questions
Q121: The government estimated that by allowing the

