The heating curve for a substance is shown below. The substance initially is a solid. It then becomes a liquid and a gas. Which of the line segments (I-V) represents the solid to liquid phase transition? 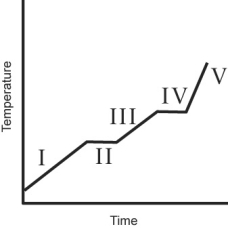
A) I
B) II
C) III
D) IV
E) V
Correct Answer:
Verified
Q3: The inside of a perfectly insulated capped
Q22: Internal energy is defined as _
A)the total
Q25: Which of the changes A-D will always
Q28: The enthalpy change is defined as _
A)
Q34: Which one of the following statements is
Q42: At a certain elevation, the boiling point
Q44: You heat a cup of coffee
Q48: A pot of water is heated
Q52: During an exothermic process, _ for
Q53: How much energy is needed to change
Unlock this Answer For Free Now!
View this answer and more for free by performing one of the following actions

Scan the QR code to install the App and get 2 free unlocks

Unlock quizzes for free by uploading documents