Ten samples of n = 5 were collected to construct an  chart.The sample mean and range for each sample are shown in the table below.
 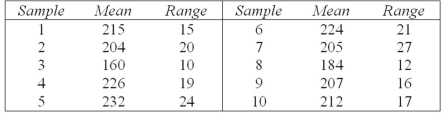 Calculate empirical lower and upper control limits for the R chart (you will need a table of control chart factors) .
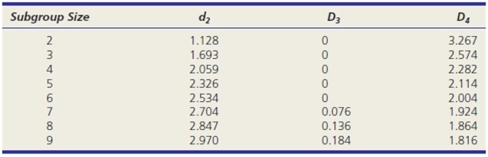
A) 0,45.86
B) 0,42.49
C) 0,38.26
D) 4.48,35.58
Correct Answer:
Verified
Q64: Find the Cpk index for a process
Q70: Find the Cpk index for a process
Q73: If the specification subgroup size is n
Q75: In manufacturing, if workers readjust the equipment
Q76: Find the Cp index for a process
Q77: Is a process capable if USL =
Q79: Ten samples of n = 5 were
Q80: Which is not characteristic of a trend?
A)Variance
Q81: Given the following control chart,which problem is
Q82: Professor Murphy wants to set up a
Unlock this Answer For Free Now!
View this answer and more for free by performing one of the following actions

Scan the QR code to install the App and get 2 free unlocks

Unlock quizzes for free by uploading documents