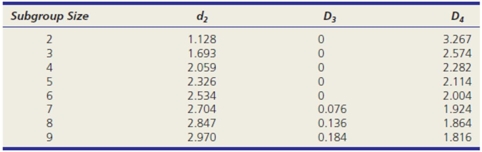
Ten samples of n = 5 were collected to construct an  chart.The sample means and ranges are in the table below.Calculate the control limits for the
  chart and R-chart.After plotting the 10 sample means and ranges on the
  and R charts,what is your conclusion? Note: You will need a table of control chart factors.
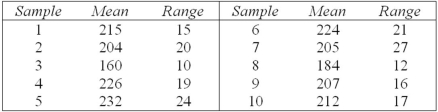
Correct Answer:
Verified
View Answer
Unlock this answer now
Get Access to more Verified Answers free of charge
Q88: Which is not primarily intended to detect
Q89: What does the first letter mean in
Q91: If LSL = 50.00, USL = 56.00,
Q93: Given the following control chart,which problem is
Q94: Which is a rule of thumb to
Q96: What,if anything,is wrong in this control chart?
Q96: What does the second letter mean in
Q99: Given the following control chart,which problem is
Q101: What,if anything,is wrong in this control chart?
Q103: Professor Murphy wants to set up a
Unlock this Answer For Free Now!
View this answer and more for free by performing one of the following actions

Scan the QR code to install the App and get 2 free unlocks

Unlock quizzes for free by uploading documents