The table below shows raw data on air pollutant levels (micrograms of particulate per liter of air)sampled at four different randomly chosen times of day on three different freeways.State the most reasonable hypotheses.What test would a statistician probably use? How many total degrees of freedom? How many degrees of freedom for the treatment(s)? How many error degrees of freedom? Explain.Do not do the F-test. 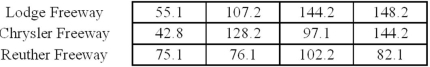
Correct Answer:
Verified
View Answer
Unlock this answer now
Get Access to more Verified Answers free of charge
Q122: What is GLM, and why do we
Q131: Refer to the following partial ANOVA results
Q132: A veterinarian notes the age (months)at which
Q133: A veterinarian notes the age (months)at which
Q134: Refer to the following partial ANOVA results
Q135: Refer to the following partial ANOVA results
Q137: A veterinarian notes the age (months)at which
Q138: As shown below,a hospital recorded the number
Q139: Refer to the following partial ANOVA results
Q140: Refer to the following partial ANOVA results
Unlock this Answer For Free Now!
View this answer and more for free by performing one of the following actions

Scan the QR code to install the App and get 2 free unlocks

Unlock quizzes for free by uploading documents