Below are shown a dot plot and summary statistics for a random sample of 34 shower heads.The measurements are maximum flow rates (in gallons per minute)at pressure of 80 pounds per square inch.Use the data to illustrate the difference between the two alternative definitions of "outlier," and make any other comments you feel are relevant.Note: TrimMean removes the smallest 5 percent and the largest 5 percent of the values. 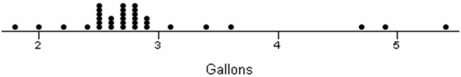

Correct Answer:
Verified
View Answer
Unlock this answer now
Get Access to more Verified Answers free of charge
Q105: Which is not a measure of variability?
A)Mean
Q118: The following table is the frequency distribution
Q120: The following frequency distribution shows the amount
Q121: A team of introductory statistics students went
Q122: Craig operates a part-time snow-plowing business using
Q124: Below are the ages of 21 CEOs.Find
Q125: Here are advertised prices of 21 used
Q126: Bob's sample of freshman GPAs showed a
Q127: Here are descriptive statistics from Excel for
Q128: The owner of a chicken farm kept
Unlock this Answer For Free Now!
View this answer and more for free by performing one of the following actions

Scan the QR code to install the App and get 2 free unlocks

Unlock quizzes for free by uploading documents