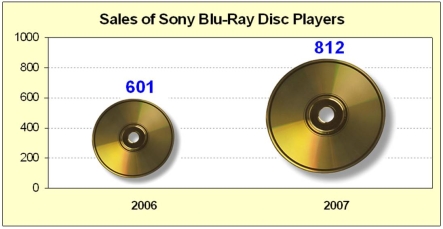
The graph below illustrates which deceptive technique? 
A) Poor Y axis scale
B) Area trick
C) Unclear grid lines
D) Dramatic title
Correct Answer:
Verified
Q65: The width of a class in a
Q65: The distribution pictured below is: 
Q66: Which of these deficiencies would be considered
Q67: An open-ended bin (e.g., "50 and over")
Q69: Below is a frequency distribution of earnings
Q70: This histogram shows Chris's golf scores in
Q71: A histogram can be defined as:
A)a chart
Q72: Bob found an error in the following
Q75: If you have 32 data points, how
Q79: If you have 256 data points, how
Unlock this Answer For Free Now!
View this answer and more for free by performing one of the following actions

Scan the QR code to install the App and get 2 free unlocks

Unlock quizzes for free by uploading documents