The graph below shows how yield in two varieties of corn respond to different environmental conditions.Which statement below is TRUE? 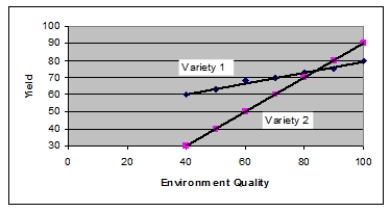
A) Under tested conditions, variety 1 has a higher yield than variety 2.
B) Under tested conditions, variety 2 has a higher yield than variety 1.
C) Under tested conditions, variety 2 is more sensitive to environment quality than variety 1.
D) Variety 1 is genetically superior to variety 2.
E) Variety 2 is genetically superior to variety 1.
Correct Answer:
Verified
Q12: Cleft palate is a birth defect in
Q32: In wheat, kernel color is determined by
Q34: Estimates of heritability made by comparing related
Q35: A certain disease phenotype is a threshold
Q37: Genetic variance is comprised of all of
Q38: The height of a type of bean
Q39: _ measures the effect of alleles at
Q40: A study was conducted to investigate the
Q41: Which of the following statements about realized
Q76: Suppose that a study of college students
Unlock this Answer For Free Now!
View this answer and more for free by performing one of the following actions

Scan the QR code to install the App and get 2 free unlocks

Unlock quizzes for free by uploading documents