Refer to the information provided in Figure 14.1 below to answer the questions that follow.
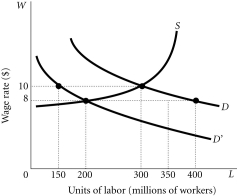 Figure 14.1
-Refer to Figure 14.1.Suppose there is a decrease in the fertility rate and this causes some men and women to place a lower value on their time spent in nonmarket activities.This will cause
A) the labor supply curve to shift to the left of S.
B) the labor supply curve to shift to the right of S.
C) the labor demand curve to shift from D to D'.
D) the labor demand curve to shift from D' to D.
Correct Answer:
Verified
Q33: Refer to the information provided in Figure
Q34: Refer to the information provided in Figure
Q39: Refer to the information provided in Figure
Q42: Suppose the wage rate in the labor
Q43: Which of the following may shift the
Q54: An increase in the productivity of workers
Q57: Which of the following may shift the
Q59: A decrease in worker productivity
A) reduces the
Q80: Those who believe that wages adjust quickly
Q124: Suppose the wage rate in the labor
Unlock this Answer For Free Now!
View this answer and more for free by performing one of the following actions

Scan the QR code to install the App and get 2 free unlocks

Unlock quizzes for free by uploading documents