Refer to the information provided in Figure 1.5 below to answer the questions that follow. 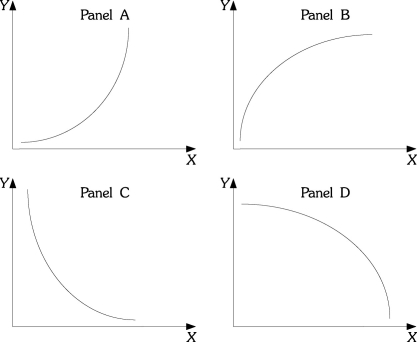 Figure 1.5
-Refer to Figure 1.5. As income increases, consumption increases, but for each additional increase in income, consumption increases by a larger and larger amount. If consumption is graphed on the vertical axis and income is graphed on the horizontal axis, the relationship between consumption and income would look like which of the following panels?
A) A
B) B
C) C
D) D
Correct Answer:
Verified
Q103: Refer to the information provided in Figure
Q104: Refer to the information provided in Figure
Q105: Refer to the information provided in Figure
Q108: Refer to the information provided in Figure
Q109: Refer to the information provided in Figure
Q110: Refer to the information provided in Figure
Q196: Refer to the information provided in Figure
Q201: If the slope of a straight line
Q207: The slope of a horizontal line is
A)
Q211: The slope of a vertical line is
A)
Unlock this Answer For Free Now!
View this answer and more for free by performing one of the following actions

Scan the QR code to install the App and get 2 free unlocks

Unlock quizzes for free by uploading documents