Refer to the information provided in Figure 1.5 below to answer the questions that follow. 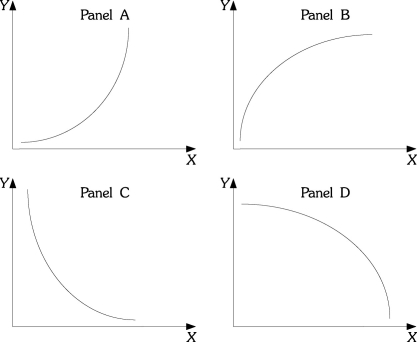 Figure 1.5
-Refer to Figure 1.5. In many industries, as firms produce additional units, average costs of production decline as the firm produces an additional unit, but average costs declines by a smaller and smaller amount as production continues to increase. If output is graphed on the horizontal axis and average costs are graphed on the vertical axis, the relationship between average costs and output would be like which of the following panels?
A) A
B) B
C) C
D) D
Correct Answer:
Verified
Q108: Refer to the information provided in Figure
Q109: Refer to the information provided in Figure
Q110: Refer to the information provided in Figure
Q207: The slope of a horizontal line is
A)
Q211: The slope of a vertical line is
A)
Q215: If the slope of a straight line
Q223: A graph illustrating how one variable changes
Q234: If as the variable on the Y-axis
Q237: If as the variable on the Y-axis
Q240: The slope of a straight line is
Unlock this Answer For Free Now!
View this answer and more for free by performing one of the following actions

Scan the QR code to install the App and get 2 free unlocks

Unlock quizzes for free by uploading documents