In Figure 17-4, below, initial demand, marginal cost, and marginal revenue curves (none of them shown) caused the firm to produce the profit-maximizing quantity Y0 at a price of P0. Now the demand and marginal cost curves have moved to those shown, with the marginal revenue curve running through point L.
Figure 17-4 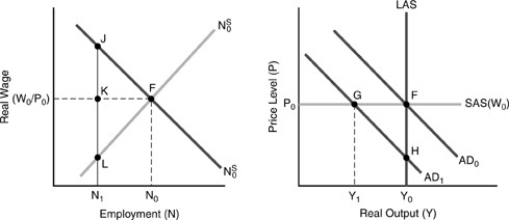
-If the firm in the figure above maintains its set price of P0, its profit is
A) G + H.
B) G + J.
C) F + G + J.
D) G + H + J + K.
E) J + K.
Correct Answer:
Verified
Q55: The basic RBC model predicts _ movements
Q57: The basic RBC model produces _ movements
Q97: One clear triumph for New Classical macroeconomics
Q106: "Non-market-clearing" approaches to macroeconomics include
A)the original Keynesian
Q113: With the assumption that some voluntary exchanges
Q119: A New Keynesian firm chooses
A)its selling price
Q133: Suppose nominal aggregate demand falls by 3
Q133: In Figure 17-4, below, initial demand, marginal
Q164: One fundamental difference between New Classical and
Q170: A primary difference between the original and
Unlock this Answer For Free Now!
View this answer and more for free by performing one of the following actions

Scan the QR code to install the App and get 2 free unlocks

Unlock quizzes for free by uploading documents