Multiple Choice
Figure 13-3 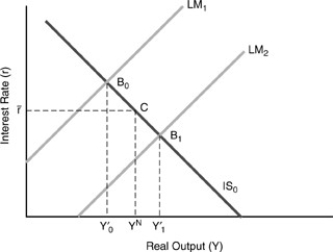
-In the figure above, suppose that the Fed maintains a fixed real money supply and that commodity demand is also fixed. The range of shifts in the LM curve, LM1 to LM2 can then only be explained by
A) changes in the velocity of money.
B) changes in the price level.
C) changes in the demand for money.
D) A and C.
Correct Answer:
Verified
Related Questions
Q73: In the mid-1980s,velocity "fell off the rails,"
Q75: When the Fed buys $10 million in
Q77: If both money demand and commodity demand
Q78: "The rigid link between monetary growth and
Unlock this Answer For Free Now!
View this answer and more for free by performing one of the following actions

Scan the QR code to install the App and get 2 free unlocks

Unlock quizzes for free by uploading documents