Figure 12-2, below, displays two time paths of consumption, C and  , which may characterize a country according to its growth policies.
Figure 12-2 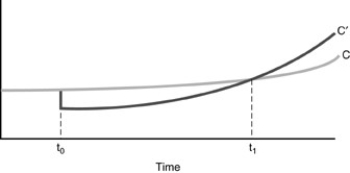
-Referring to Figure above, we may conclude
A) Path C' represents the effects of a policy to lower savings from time to t1 forward.
B) Path C' represents the effects of a policy to lower savings from time t0 to t1.
C) Path C' represents the effects of a policy to lower savings from time t1 forward.
D) Path C' represents the effects of a policy to lower savings from time to t1.
Correct Answer:
Verified
Q34: If the economy is growing 5% a
Q35: If the country in the figure above
A)
Q40: Gordon reports that during the Reagan administration
Q42: Between 1995 and 1998 Federal tax revenues
Q76: Which of the following policies is likely
Q77: National saving is
A)the sum of private saving
Q89: Over a decade or longer,a government budget
Q95: "In the 1980s the pain which results
Q100: Government debt places a burden on future
Q109: From 1981 till 1995,the ratio of revenue
Unlock this Answer For Free Now!
View this answer and more for free by performing one of the following actions

Scan the QR code to install the App and get 2 free unlocks

Unlock quizzes for free by uploading documents