Figure 10-5 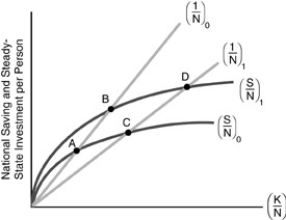
-In the figure above, suppose that the economy's initial steady-state point is A. An increase in the rate of national saving changes the steady-state point to
A) point B.
B) point C.
C) point D.
D) a point to the left of point A.
Correct Answer:
Verified
Q50: The new growth theory that arose in
Q57: In the graph of the Solow growth
Q58: In the Solow growth model,from an initial
Q69: In graphing the Solow growth model,the per-person
Q77: If K = 3000,n = 0.015,and d
Q78: Suppose that the capital stock initially is
Q81: The most surprising outcome of the Solow
Q94: Figure 10-5 Q96: In the Solow growth model, given the Q101: Figure 10-5 ![]()
![]()
Unlock this Answer For Free Now!
View this answer and more for free by performing one of the following actions

Scan the QR code to install the App and get 2 free unlocks

Unlock quizzes for free by uploading documents