Figure 8-5 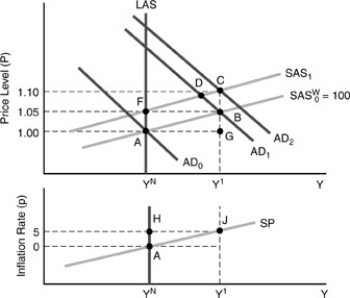
-In the figure above, the wage rate attached to SAS1 is
A) 1.10.
B) between 1.05 and 1.10.
C) 1.05.
D) 1.00.
Correct Answer:
Verified
Q51: Along the SP curve with expected inflation
Q60: At every current AD/SAS equilibrium point to
Q62: At any point on the current SP
Q63: The "long-run Phillips Curve" is the set
Q72: Along the SP curve with expected inflation
Q73: A rise in expected inflation causes
A)the SP
Q82: From a long-run equilibrium with p =
Q86: With a permanent acceleration in nominal GDP
Q90: Whenever x exceeds p,
A)y must be positive.
B)y
Q169: From an initial AD/SAS/LAS equilibrium with price
Unlock this Answer For Free Now!
View this answer and more for free by performing one of the following actions

Scan the QR code to install the App and get 2 free unlocks

Unlock quizzes for free by uploading documents