Multiple Choice
Figure 8-5 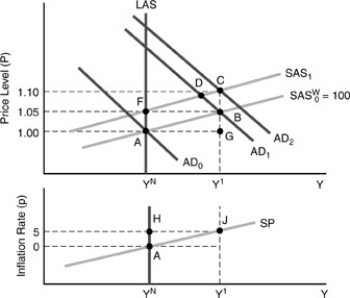
-In the figure above, if we move from points A to B to C in the top diagram, this is translated to the bottom diagram as a move from points
A) A to J and back to A.
B) A to J.
C) A to H.
D) A to J to H.
E) A to H and back to A.
Correct Answer:
Verified
Related Questions
Q49: Suppose that an adverse supply shock causes
Q55: Suppose than successive AD/SAS equilibrium points run
Q56: When the expected inflation rate is 5
Q57: At every current AD/SAS equilibrium point to

