Multiple Choice
Figure 8-6 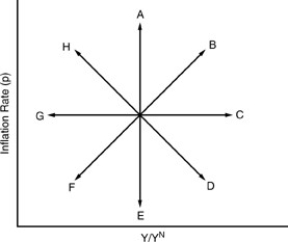
-In the figure above, the one year since 1970 that the U.S. economy managed to travel along path E was
A) 1971.
B) 1970.
C) 1979.
D) 1986.
Correct Answer:
Verified
Related Questions
Q3: The inflation rate,actual employment rate and natural
Q10: The natural unemployment rate fell in the
Q12: In 1991,the growth rate of nominal GDP
Q84: With a "cold turkey" disinflationary policy of

