Figure 7-1 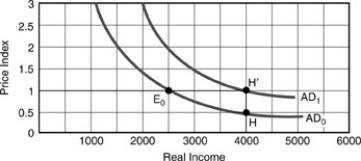
-Employing Figure above, assume that the initial equilibrium Y was 2500 at E0 prior to a change in the nominal money supply. The movement from E0 to  represents
A) an increase in the nominal money supply with a constant interest rate.
B) an increase in the nominal money supply with a constant price level.
C) a decrease in the nominal money supply with a constant price level.
D) a decrease in the nominal money supply with a rising interest rate.
Correct Answer:
Verified
Q1: A steeper LM curve implies that the
Q5: If money demand relative to the level
Q9: The slope of the SAS curve is
Q10: Let the government increase lump-sum taxes.The aggregate
Q13: Which of the following factors will not
Q14: An increase in the price level will
A)increase
Q15: The AD curve will shift to the
A)right
Q18: Suppose that the administration proposes to follow
Q29: An increase in the nominal money supply
Q44: If there are perfectly flexible prices and
Unlock this Answer For Free Now!
View this answer and more for free by performing one of the following actions

Scan the QR code to install the App and get 2 free unlocks

Unlock quizzes for free by uploading documents