Figure 5-1 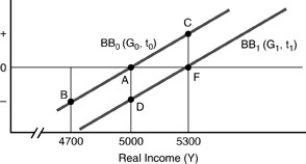
-Employing the government budget diagram shown in the figure above, assume that the economy is initially in equilibrium at point A. The movement A to D represents
A) an increase in government spending and/or a decrease in taxes.
B) a decrease in government spending and/or an increase in taxes.
C) a decrease in government spending and a decrease in taxes.
D) an increase in government spending and an increase in taxes.
Correct Answer:
Verified
Q1: Figure 5-1 Q3: Figure 5-1 Q3: The three ways of reducing a government Q13: During the fiscal expansion associated with the Q22: Persistent government budget deficit result in _ Q27: The natural employment surplus _ be used Q29: A deliberate change in the government's deficit Q32: Which of the following effects takes place Q35: An increase in the tax rate (t) Q39: The natural employment deficit _ be used![]()
![]()
A)constitutes
A)will
Unlock this Answer For Free Now!
View this answer and more for free by performing one of the following actions

Scan the QR code to install the App and get 2 free unlocks

Unlock quizzes for free by uploading documents