Figure 3-3 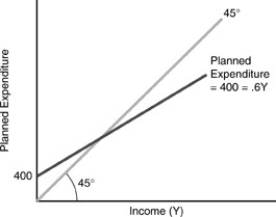
-In the figure above, autonomous planned spending is
A) 400.
B) 400 + 0.6Y.
C) 0.8Y.
D) 400 - 0.6Y.
E) 0.
Correct Answer:
Verified
Q3: Suppose that in producing a GDP of
Q17: During the worst of the Great Depression,in
Q43: In the consumption function,suppose a = 60,c
Q44: On a diagram of the consumption function
Q48: In the consumption function C = a
Q54: In our consumption function,when disposable income is
Q55: When stock prices fall significantly,people may feel
Q60: Total income is always equal to _
Q69: In the consumption function C = a
Q83: On a diagram of the planned expenditure
Unlock this Answer For Free Now!
View this answer and more for free by performing one of the following actions

Scan the QR code to install the App and get 2 free unlocks

Unlock quizzes for free by uploading documents