Multiple Choice
Figure 3-4 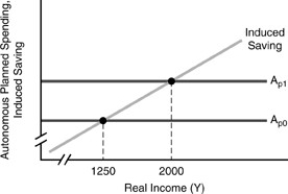
-In the figure above, the shift from AP0 to AP1 could have been caused by a rise in net exports of
A) 180.
B) 750.
C) 120.
D) 300.
Correct Answer:
Verified
Related Questions
Q50: In the consumption function C = a
Q86: Figure 3-3 Q88: Income on the horizontal axis at which Q88: Should autonomous consumption fall by one dollar, Q93: Income on the horizontal axis at which![]()
Unlock this Answer For Free Now!
View this answer and more for free by performing one of the following actions

Scan the QR code to install the App and get 2 free unlocks

Unlock quizzes for free by uploading documents