Multiple Choice
Figure 3-4 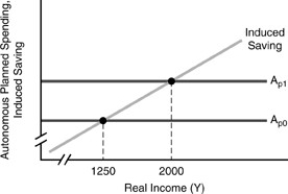
-In the figure above, the shift from AP0 to AP1 could have been caused by a ________ in T of ________.
A) fall, 300
B) fall, 180
C) fall, 500
D) rise, 300
E) rise, 500
Correct Answer:
Verified
Related Questions
Q6: A variable which is independent of the
Q47: Suppose a = 50,c = 0.8,and T
Q52: Saving is positive for all levels of
Q56: If Y = $200 billion,c = 0.75,autonomous
Q58: The slope of the planned expenditure line

