Multiple Choice
Figure 3-5 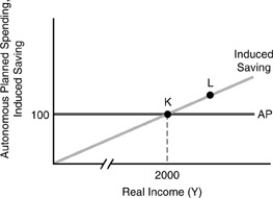
-In figure above, the marginal propensity to save is
A) 0.20.
B) 0.80.
C) 0.05.
D) 0.02.
Correct Answer:
Verified
Related Questions
Q45: If Y = $200 billion,c = 0.75,autonomous
Q73: In equilibrium,
A)income = planned expenditures.
B)unplanned inventory investment
Q99: Figure 3-4 Q101: Figure 3-6 Q104: Figure 3-7 Q105: Figure 3-7 Q107: Figure 3-5 Q108: Which of the components of total planned Q108: Figure 3-7 Q139: When planned autonomous spending rises,the planned expenditure Unlock this Answer For Free Now! View this answer and more for free by performing one of the following actions Scan the QR code to install the App and get 2 free unlocks Unlock quizzes for free by uploading documents![]()
![]()
![]()
![]()
![]()
![]()

