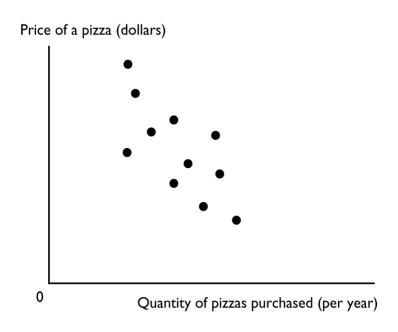
-The figure above shows a
A) time-series graph.
B) scatter diagram.
C) cross-section graph.
D) slope.
E) trend diagram.
Correct Answer:
Verified
Q141: Which of the following is a positive
Q142: Which of the following is NOT a
Q143: The vertical axis in a graph
A) is
Q144: A graph shows the wage rate of
Q145: Which type of graph is most useful
Q147: A positive statement
A) must always be right.
B)
Q148: A steep slope in a time series
Q149: Most economic graphs have two lines perpendicular
Q150: Most economic graphs have two lines perpendicular
Q151: A time-series graph displays the price of
Unlock this Answer For Free Now!
View this answer and more for free by performing one of the following actions

Scan the QR code to install the App and get 2 free unlocks

Unlock quizzes for free by uploading documents