Multiple Choice
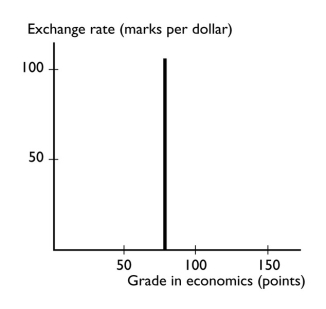
-The graph shows
A) a positive relationship that becomes less steep.
B) a negative relationship that is linear.
C) a positive relationship that is linear.
D) no relationship between the variables.
E) a trend relationship between the variables.
Correct Answer:
Verified
Related Questions

