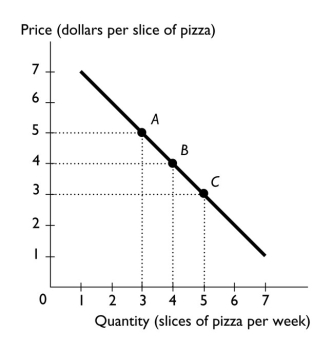
-The above figure shows the relationship between the price of a slice of pizza and how many slices of pizza Ricardo buys in a week.Between points A and B,the slope of the line equals
A) -5.
B) -4.
C) -3.
D) -1.
E) -2
Correct Answer:
Verified
Q230: A curve with a positive but decreasing
Q231: Q232: The slope Q233: "The change in the value of the Q234: If the quantity of the variable on Q236: If the quantity of the variable on Q237: Suppose the relationship between a person's age Q238: Moving rightward along a straight line,the slope Q239: With y measured on the vertical axis Q240: In a graph,a straight line has a![]()
A) of a straight line is
Unlock this Answer For Free Now!
View this answer and more for free by performing one of the following actions

Scan the QR code to install the App and get 2 free unlocks

Unlock quizzes for free by uploading documents