Multiple Choice
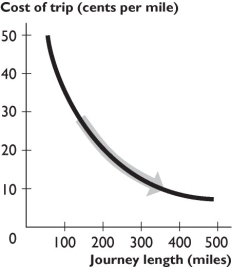
-The figure above shows the relationship between the journey length and the cost of trip per mile.The curve becomes flatter because as the journey length increases,
A) the fall in the cost per mile becomes smaller.
B) the fall in the cost per mile becomes greater.
C) the cost per mile decreases.
D) the cost per mile increases.
E) the cost per mile remains unchanged.
Correct Answer:
Verified
Related Questions
Q205: Why do economists say that even very
Q210: What do economists mean when they discuss
Q217: Define economics and describe its branches of
Unlock this Answer For Free Now!
View this answer and more for free by performing one of the following actions

Scan the QR code to install the App and get 2 free unlocks

Unlock quizzes for free by uploading documents