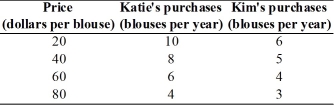
-The table above shows how many blouses Katie and Kim will purchase at different prices for a blouse.In the figure,label the axes and put the price on the y-axis and the quantity of blouses on the x-axis.Plot the data for Katie in the figure.Then,plot the data for Kim in the figure.
Correct Answer:
Verified
View Answer
Unlock this answer now
Get Access to more Verified Answers free of charge
Q236: Explain whether the statement, "There is life
Q319: In New State,the bottling law requires that
Q320: Shaniq can spend the next hour studying
Q321: Q322: In the diagram below,label the x-axis,the y-axis,and Q328: In the diagram below,draw a straight line Unlock this Answer For Free Now! View this answer and more for free by performing one of the following actions Scan the QR code to install the App and get 2 free unlocks Unlock quizzes for free by uploading documents![]()

