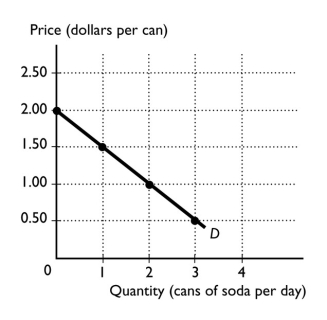
-The graph illustrates the demand curve for soda.After a rise in the price of a soda from $1.00 a can to $2.00 a can,the quantity of soda demanded
A) decreases from 2 cans to 0 cans a day.
B) increases from 0 cans to 2 cans a day.
C) remains unchanged.
D) decreases from 1 can to 0 cans a day.
E) cannot be determined from the figure because the demand curve will shift to a new curve.
Correct Answer:
Verified
Q91: The supply schedule
A) shows the relationship between
Q92: The law of supply reflects the fact
Q93: The law of supply states that other
Q94: Which of the following increases the quantity
Q95: To be part of the supply for
Q97: If the price of iPods decreases,
A) there
Q98: Which of the following results in a
Q99: The number of buyers of sport utility
Q100: Pizza and tacos are substitutes,and the price
Q101: An increase in the number of fast-food
Unlock this Answer For Free Now!
View this answer and more for free by performing one of the following actions

Scan the QR code to install the App and get 2 free unlocks

Unlock quizzes for free by uploading documents