Multiple Choice
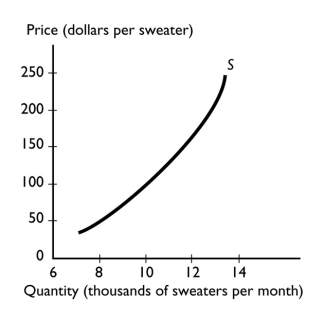
-The graph illustrates the supply of sweaters.A fall in the price of sweaters brings
A) a movement along the supply curve.
B) a decrease in the quantity supplied of sweaters.
C) a shift of the supply curve.
D) Both answers A and B are correct.
E) Both answers B and C are correct.
Correct Answer:
Verified
Related Questions
Q173: If the price is below the equilibrium
Q174: Market equilibrium occurs when
A) all markets become
Q175: If there is a surplus of tacos,then
Q176: When there is a shortage of parking
Q177: Market equilibrium occurs when
A) the quantity demanded
Q179: If the price of carrots is below
Q180: When the price of rice rises,
A) the

