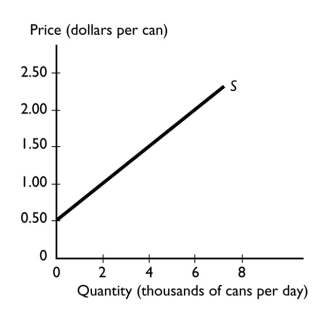
-The graph illustrates the supply of soda.If the price of soda rises from $0.50 a can to $1.50 a can,the quantity of soda supplied
A) increases from 0 cans to 4,000 cans a day.
B) decreases from 4,000 cans to 0 cans a day.
C) remains unchanged because the supply increases not the quantity supplied.
D) increases from 0 to 6,000 cans a day.
E) remains unchanged because the supply decreases not the quantity supplied.
Correct Answer:
Verified
Q142: Wheat is used to produce cereal.When the
Q160: Q161: Market equilibrium Q162: An increase in the productivity of producing Q163: As a falling price eliminates a surplus![]()
i.can never occur because there are
Unlock this Answer For Free Now!
View this answer and more for free by performing one of the following actions

Scan the QR code to install the App and get 2 free unlocks

Unlock quizzes for free by uploading documents