Multiple Choice
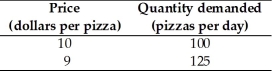
-The data in the table above give two points on the demand curve for pizza.Using the midpoint method,when the price of a pizza falls from $10 to $9,what is the percentage change in the quantity demanded?
A) 22.2 percent
B) 10.0 percent
C) 15.5 percent
D) 5.2 percent
E) 25 percent
Correct Answer:
Verified
Related Questions
Q65: During last year the price of regular
Q66: If a 4 percent change in the
Q67: If the price elasticity of demand for
Q68: When the price of Cosmopolitan magazine decreases

