Multiple Choice
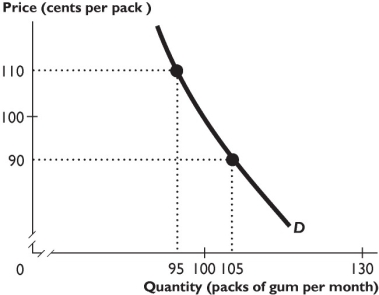
-The demand curve shown in the figure above is ________ over the price range from $0.90 to $1.10 per pack.
A) perfectly elastic
B) perfectly inelastic
C) unit elastic
D) elastic but not perfectly elastic
E) inelastic but not perfectly inelastic
Correct Answer:
Verified
Related Questions
Q255: If beef and pork are substitutes for
Q256: If a product is a normal good,then
Q257: Q258: Which of the following is most likely Q259: Q261: Q262: Suppose Starbucks currently charges $2.50 per cup Q263: A _ curve means that _. Unlock this Answer For Free Now! View this answer and more for free by performing one of the following actions Scan the QR code to install the App and get 2 free unlocks Unlock quizzes for free by uploading documents![]()
![]()
![]()
A) horizontal

