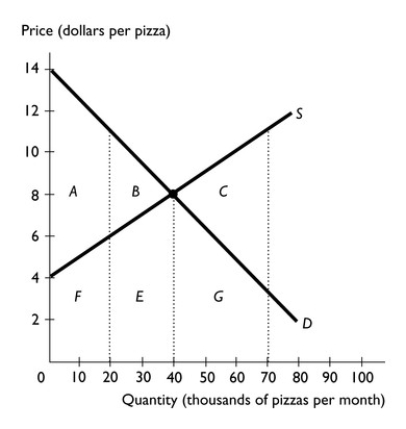
-The figure above shows the supply and demand for pizza.
a.What is the efficient level of output?
b.If 70,000 pizzas are produced,what area represents the deadweight loss?
c.Why does the deadweight loss in part (b)occur?
d.If 20,000 pizzas are produced,what area represents the deadweight loss?
e.Why does the deadweight loss in part (d)occur?
Correct Answer:
Verified
View Answer
Unlock this answer now
Get Access to more Verified Answers free of charge
Q359: Q360: What are some of the potential obstacles Q386: Often politicians assert that a price, such Q397: How can a person argue that health Unlock this Answer For Free Now! View this answer and more for free by performing one of the following actions Scan the QR code to install the App and get 2 free unlocks Unlock quizzes for free by uploading documents![]()

