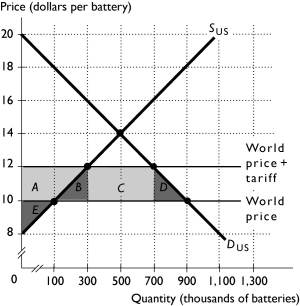
-The above figure shows the U.S.market for replacement cell phone batteries.With free trade,U.S.production is equal to ________ batteries per year.When a $2 tariff is in place,U.S.production is equal to ________ batteries per year.
A) 100,000; 300,000
B) 100,000; 500,000
C) 300,000; 100,000
D) 300,000; 500,000
E) 900,000; 700,000
Correct Answer:
Verified
Q125: Relative to free trade,domestic producers of a
Q126: If a tariff is imposed on imports
Q127: Q128: If the United States imposes a tariff Q129: Of the following,which group is hurt by Q131: Relative to free trade,domestic consumers of a Q132: Of the following,who is harmed by a![]()
Unlock this Answer For Free Now!
View this answer and more for free by performing one of the following actions

Scan the QR code to install the App and get 2 free unlocks

Unlock quizzes for free by uploading documents