Multiple Choice
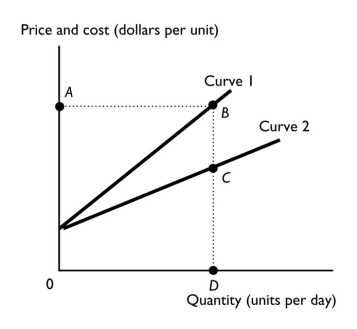
-The figure above represents the relationship between output and cost in an industry with an external cost.Which line represents the marginal private cost (MC) curve?
A) Curve 1
B) Curve 2
C) the dotted line BC
D) the y-axis
E) the dotted line AB
Correct Answer:
Verified
Related Questions

