Multiple Choice
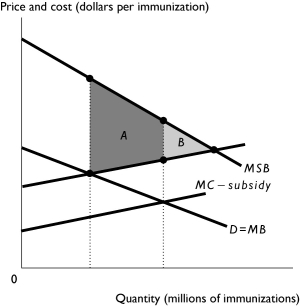
-The figure above shows the market for annual influenza immunizations the United States.Area A + Area B is the
A) deadweight loss when there is not the illustrated subsidy.
B) loss in efficiency from the illustrated subsidy.
C) gain in efficiency from the illustrated subsidy.
D) remaining deadweight loss when there is the illustrated subsidy.
E) equilibrium with the illustrated subsidy.
Correct Answer:
Verified
Related Questions

