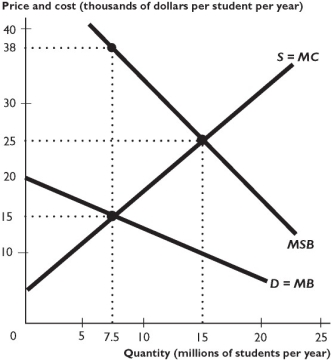
The figure above shows the demand for college education (D) , the marginal social benefit of college education (MSB) , and the marginal cost of the private schools (MC) .
-The figure above shows that at the unregulated market equilibrium,marginal social benefit ________ marginal cost,and the number of students enrolled is ________.
A) exceeds; above the efficient quantity
B) exceeds; below the efficient quantity
C) is below; above the efficient quantity
D) is below; below the efficient quantity
E) equals; efficient
Correct Answer:
Verified
Q227: When Ronald takes another economics class,other people
Q228: Q229: In the figure above,when the market is Q230: Q231: In the figure above,if a pollution tax Q233: In an unregulated market with an external Unlock this Answer For Free Now! View this answer and more for free by performing one of the following actions Scan the QR code to install the App and get 2 free unlocks Unlock quizzes for free by uploading documents![]()
![]()

