Multiple Choice
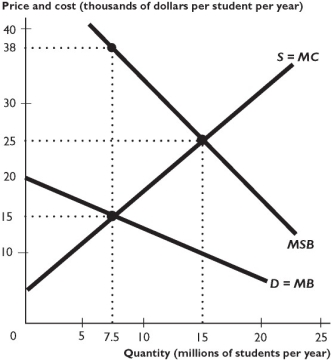
The figure above shows the demand for college education (D) , the marginal social benefit of college education (MSB) , and the marginal cost of the private schools (MC) .
-Using the figure above,suppose a subsidy of $15,000 per student is provided to private colleges.When the market is in equilibrium,marginal social benefit ________ marginal cost,and the number of students enrolled is ________.
A) exceeds; above the efficient quantity
B) exceeds; below the efficient quantity
C) is below; above the efficient quantity
D) is below; below the efficient quantity
E) equals; efficient
Correct Answer:
Verified
Related Questions
Q255: When property rights are assigned and transactions

